Dyno
- Home
- Dyno
Comprehensive, best-in-class capabilities for data integration, data quality, analytics, & AI/ machine learning.
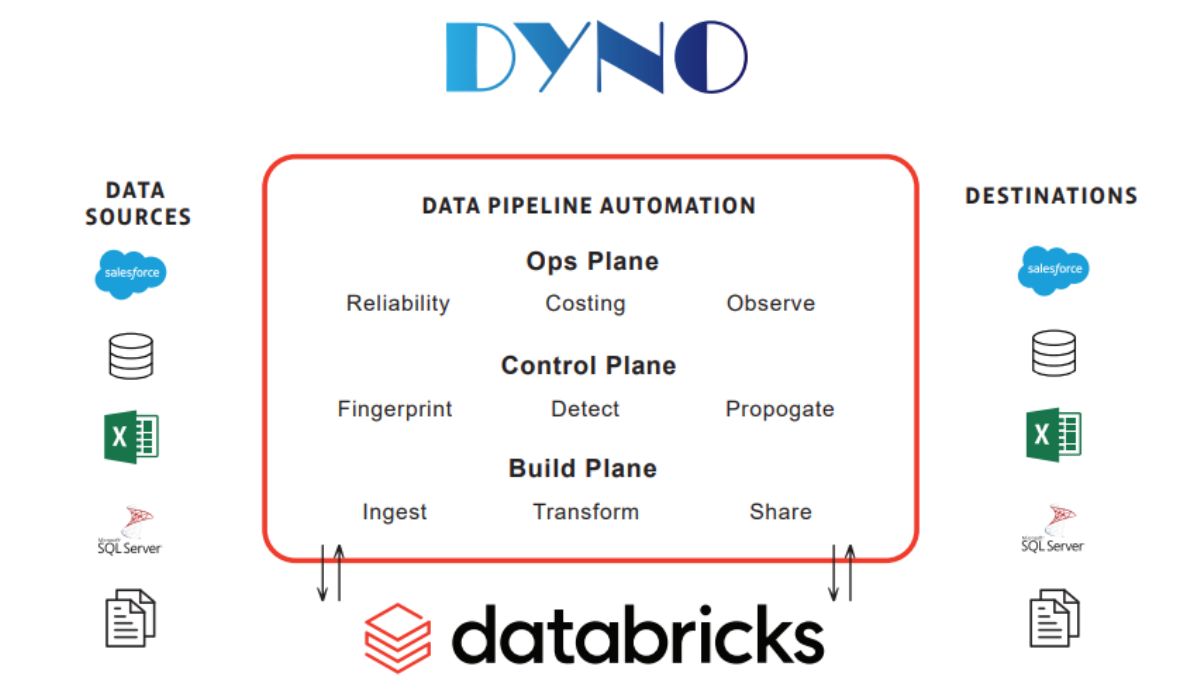
Lakehouse-native Data Quality Checks With Al-powered Anomaly Detection, Incident Alerts, and Issue Remediation Workflows. Enterprises across industries are accumulating and processing huge volumes of data for advanced analytics and ML applications. But, handling data at petabyte-scale brings many challenges — ranging from infrastructure management requirements, to provisioning bottlenecks, to high costs of acquisition and maintenance. Databricks is designed to remove those barriers.


Modernize Business Intelligence with Dyno and DataBricks
- Deliver low latency BI workloads natively on a Databricks Lakehouse
- Establish a "Diamond Layer" for analysis-ready data across BI, Data Science, and ML tools
- Support legacy "Cube" workloads (i.e. SSAS) on a Databricks Lakehouse
- Extend dialect support on Databricks Lakehouse for Power BI (DAX), Excel (MDX), Python, and SQL
Introduction
As a powerful cloud-based enterprise Data Lakehouse platform, Databricks is fine-tuned for processing, storing, and analyzing massive data volumes for a variety of use cases, such as:
- Running analytical queries
- Streaming
- Batch transformations
- ETL orchestration
To ensure good data quality across these design patterns, enterprises need modern data quality monitoring tools that are powerful, easy-to-use, extensible, and deeply integrated with Databricks. That’s where Dyno’s Lakehouse-native Data Quality checks with Al-powered Anomaly Detection come in to help drive high confidence and trust in Databricks data by consumers and users.
3 Key Challenges of Modernizing Data Stacks


When processing thousands of tables from multiple data sources with hundreds of columns in Databricks, you need granular control of data quality and real-time visibility into data pipeline health. With modern data stacks supporting data-driven applications, enterprises want to consume data as soon as it’s available, which gets harder and more complicated due to:
- Massive Data Volumes
- High Data Cardinality
- Ever-changing Data Models
When running SQL queries in Databricks, it’s critical to deploy partition-aware data quality checks, because it’s very easy to do full table
scans or scan more partitions than necessary. Given how data-driven applications are, a break in data pipelines can lead to severe financial and operational consequences for businesses. Dyno automatically recognizes partitions, ensuring every data quality query is efficient and optimized for scalability and high performance.
Combining Dyno and Databricks enables our joint customers to trust their data in Databricks on day zero.
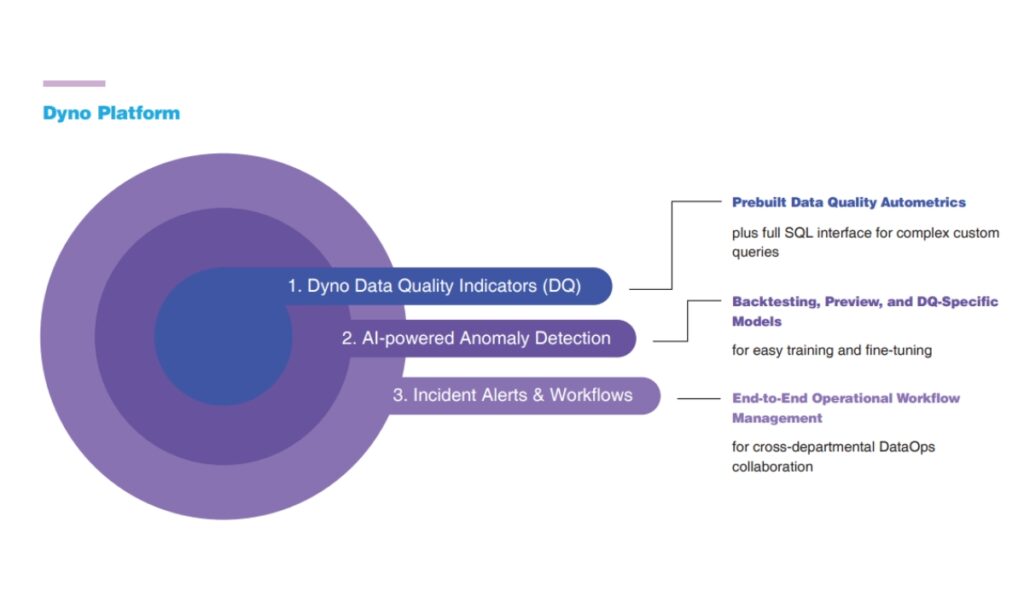
Get full visibility into the health of Databricks data pipelines with Dyno efficieni pushdown Data Quality checks and Al-powered anomaly detection, enabling data teams to quickly identify bad data, pinpoint elusive silent errors, and remediate incidents before downstream data processing and analytics services are rendered unusable. Dyno is highly flexible and extensible with out-of-the-box integrations with IT ticketing , chat tools, email, data management, and workflow platforms, enabling you to consolidate incidents and file tickets directly from Dyno for efficient end-to-end DataOps management at scale.
What does Data Quality mean to Dyno?
Data Availability
Data doesn't arrive on time, isn't available, or isn't the right volume.
Data Comformity
Data no longer conforms to the agreed upon dimensions, resulting in schema change(s), dropped column(s), column data type change(s).
Data Validity
Data itself isn't valid - columns aren't registering correct values or columns contain too many null values.
Data Reconciliation
Data is compared and reconciled between two different stages in the pipeline during movement and transformation


Dyno Key Features
- No-code Data Quality Checks
- Intuitive Graphical UI
- Custom Data Quality Checks
- Al-powered Anomaly Detection
- Real-Time Monitoring and Alerts
- Failing Records with Root Cause Analysis and Remediation
Top 3 Dyno Data Quality Design Patterns for Databricks
Scheduled Checks
When processing pipeline transformation operations, such as going from one delta table to another, run data quality checks on a schedule at different series of the pipelines.
Trigger Mode
When orchestrating ETL and declaring pipeline definitions, include closed-loop response actions before processing data further — such as quarantining bad data or breaking the pipeline upon data quality failures.
Delta Live Tables
When processing high-volume streaming data with no latency, insert and deploy a structured streaming job in the Databricks cluster, which continuously calculates DOls as new data arrives, with sub-second data processing and analysis.


